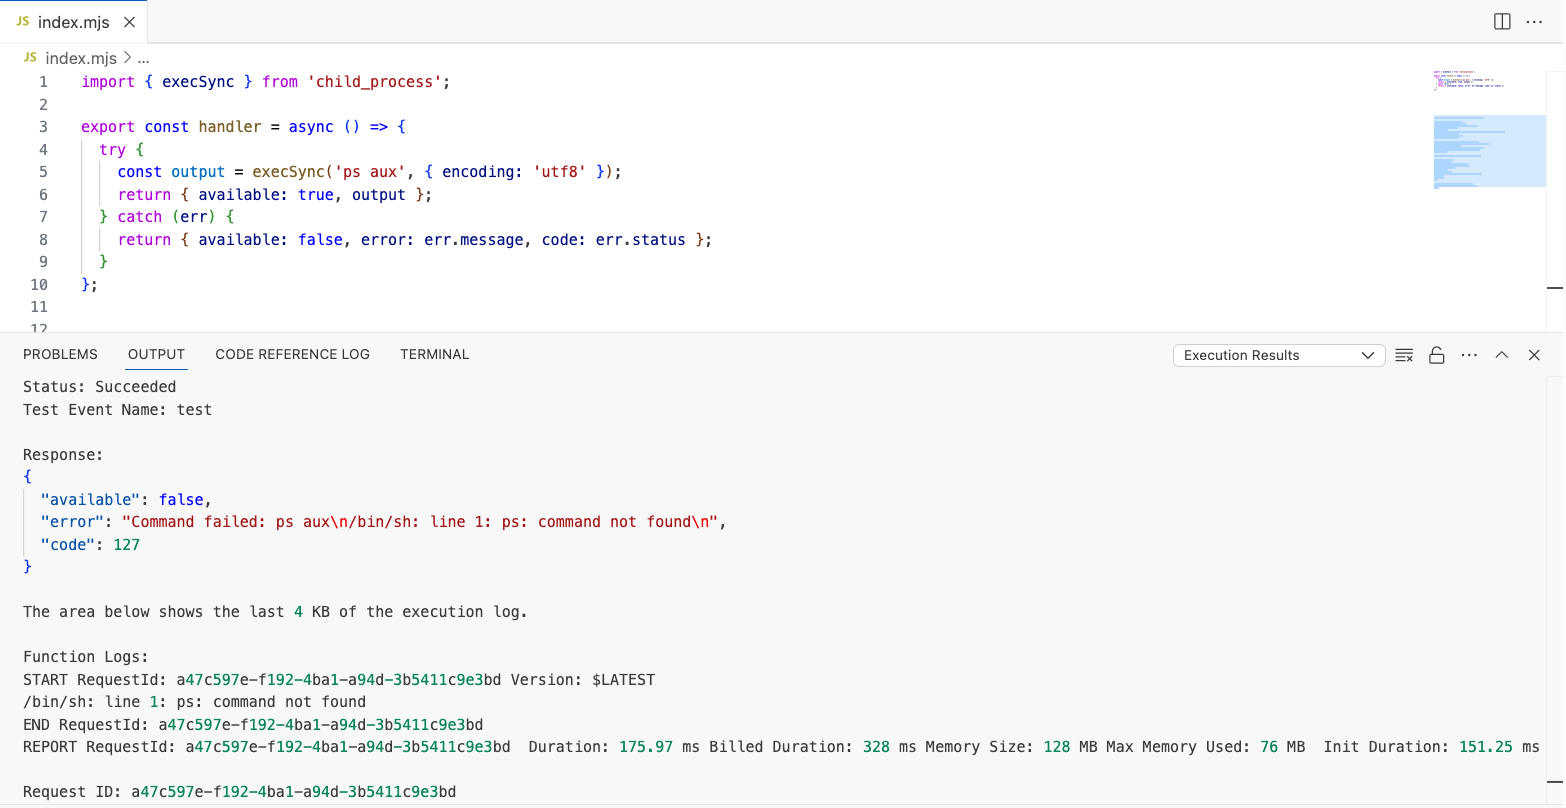
When diagnosing a memory leak I suspected was caused by orphaned processes, I ran into a snag with ps not being available within the AWS Lambda NodeJS runtime (potentially other ones as well).
Instead I had to do things the hard way.
On Linux environments /proc/${PID}/* reveals equivalent information (as ps and many other commands). For a full list of the entries available visit the kernel docs.
The majority of ps information can be obtained from /proc/${PID}/cmdline and /proc/${PID}/status.
Putting all of this together we can iterate over all processes within /proc print their status and command.
import { exec } from 'child_process';
import { readdirSync, readFileSync } from 'fs';
function listProcesses() {
return readdirSync('/proc')
.filter(entry => /^\d+$/.test(entry))
.flatMap(pid => {
try {
const cmdline = readFileSync(`/proc/${pid}/cmdline`, 'utf8')
.split('\0')
.filter(Boolean)
.join(' ');
const status = Object.fromEntries(
readFileSync(`/proc/${pid}/status`, 'utf8')
.split('\n')
.filter(line => line.includes(':'))
.map(line => line.split(':\t'))
);
return [{
pid,
name: status['Name'],
state: status['State'],
cmdline,
}];
} catch {
return [];
}
});
}
export const handler = async () => {
// intentionally no execSync / no await to ensure the sleep is running during listProcess execution
exec('sleep 5');
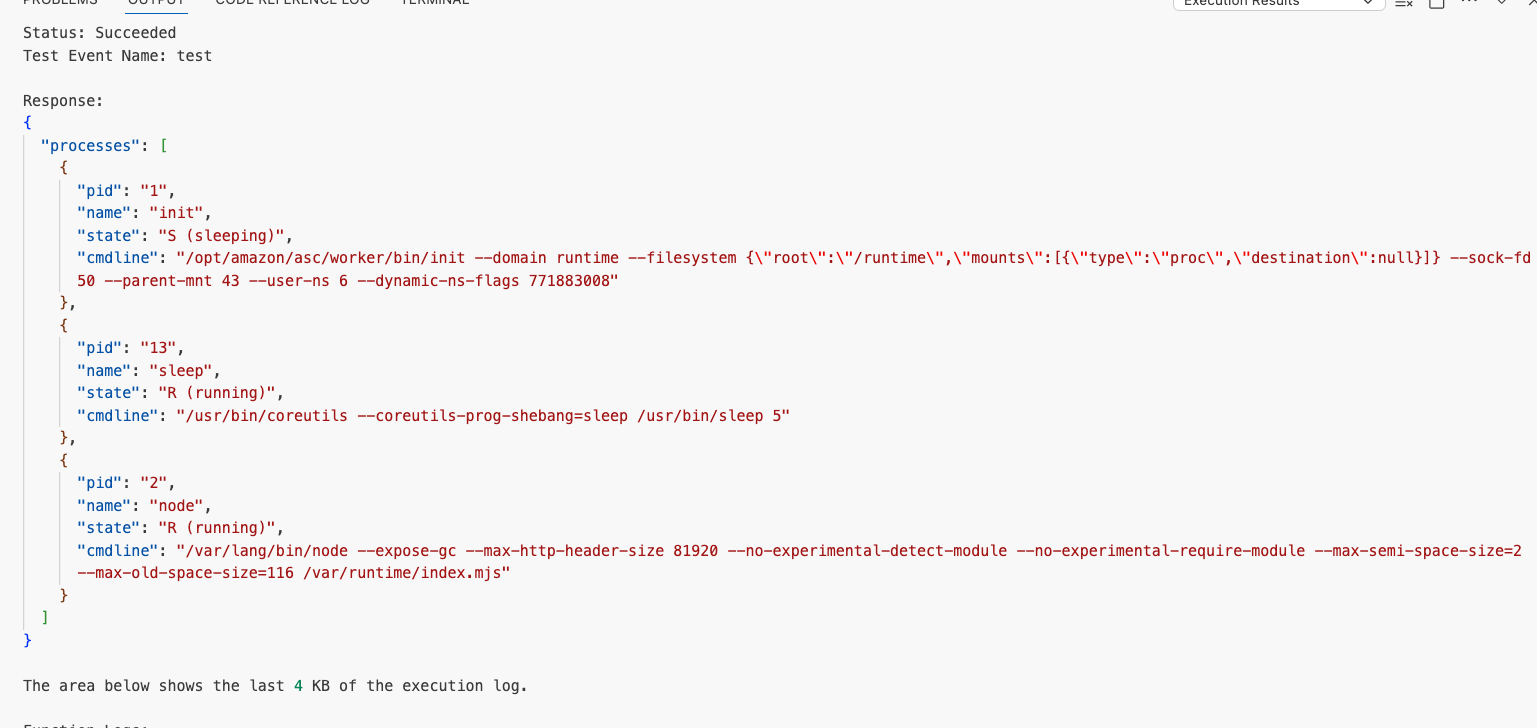
return { processes: listProcesses() };
};
Which when run yields a ps equivalent like output and was able to help me diagnose the orphaned process causing a memory leak!